
How to be a Top Geographer!
On this page you will find tips and tricks and links to resources to help you to become a first class Geographer - GOOD LUCK!
Top Geographers are always asking questions, they are like detectives
Get into the habit of doing this when you see, read or hear information - take a look at this resource then answer the questions above.
Remember: Top Geographers always 'tag' their sources (say where they got information from)
Source: http://www.bbc.co.uk/news/world-us-canada-38387525
- Who?
- What?
- When?
- Where?
- How?
- Why?
Get into the habit of doing this when you see, read or hear information - take a look at this resource then answer the questions above.
Remember: Top Geographers always 'tag' their sources (say where they got information from)
Source: http://www.bbc.co.uk/news/world-us-canada-38387525
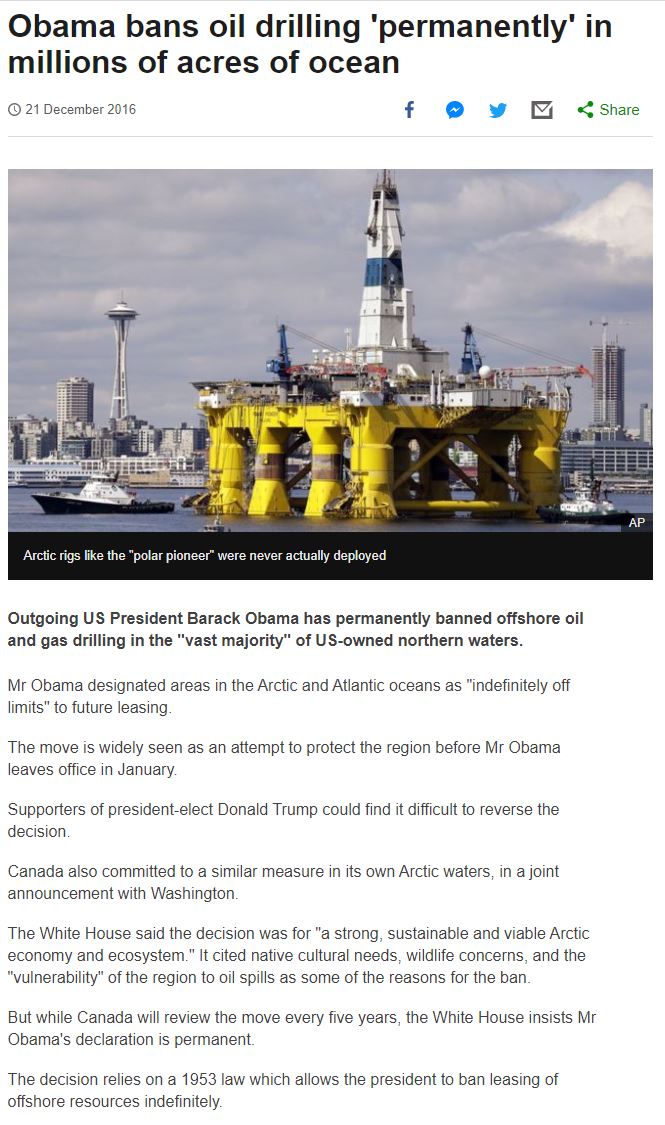
Whilst this is a reliable resource, it came from the BBC news website, the big problem is that it does NOT say when it was written, only when it was published. So we might be quoting facts from it that are out of date and no longer valid.
1. How to locate places accurately
In Geography you will be expected to talk and write about REAL-LIFE examples, these are called CASE STUDIES. The first thing we do when talking about a case study is to name and locate it.
For example, you might be learning about earthquakes and you might be studying the Los Angeles earthquake.
To locate the place we always try to include the following detail, in this order:
town/city/region name - location in the country - continent - hemisphere
Los Angeles - West coast of USA - North America - northern hemisphere
ALTERNATIVELY you can always C L O C C K it
Place Continent Latitude Ocean Country Compass Point Kilometres
Tacloban Asia 11 degrees N Pacific Philippines East coast 540 km from Manila
2. Always do exactly what the question asks you!
If the question asks you to look at or use a resource then be sure to do that and quote some facts/information from the source .......
Skills Check: Study the graph below then try this ..... 'Describe the pattern of temperature in this location'
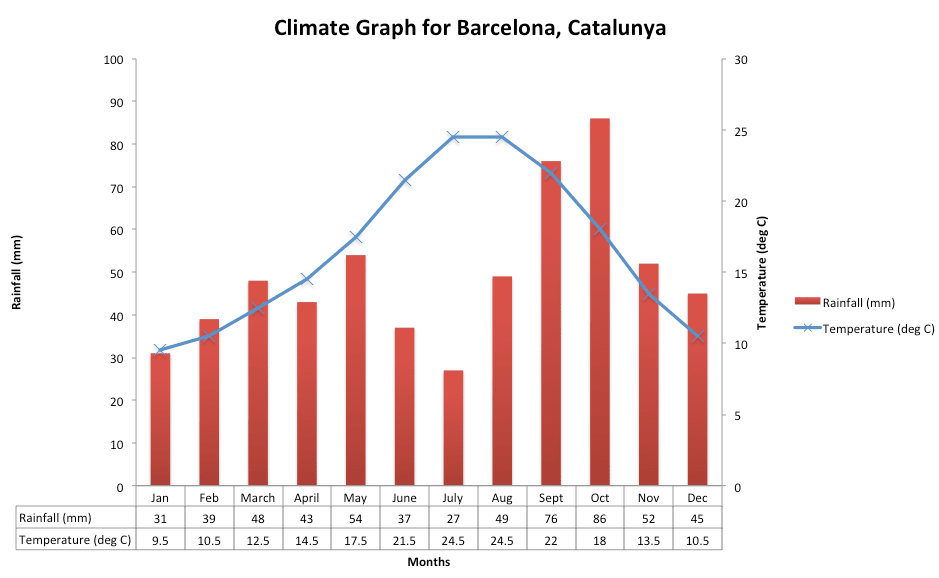
How did you get on? Here's what you might have written for a perfect answer.
'Temperatures are lowest in Winter (Dec-Jan 10 degrees) then rise steadily to 25 degrees in Summer (July-Aug), after which time they drop back down steadily'.
3a. How to draw a perfect bar graph
Ok, so it takes a bit of practice but if you remember the following you will be on to a winner
Equipment needed: ruler and pencil (and an eraser if you are feeling unlucky!)
Your secret to success is to follow the rhyme 'All Four Top Drawer'
1. Title 'a bar chart to show .....'
2. Label the x axis - don't write 'x-axis', instead write what it is about
3. Label the y axis - don't write 'y-axis', instead write what it is about
4. Make sure the graph is accurate, neat and coloured in. If it needs a key ... add one!
Over To You: Let's check this graph out and see how well they did ......
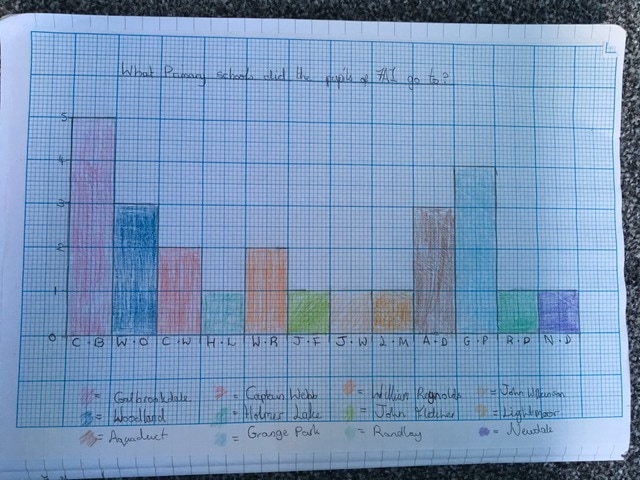
1. Title 'a bar/line/scatter/composite/pie chart to show .....' Partly, YES :-)
2. Label the x axis - don't write 'x-axis', instead write what it is about NO :-(
3. Label the y axis - don't write 'y-axis', instead write what it is about NO :-(
4. Make sure the graph is accurate, neat and coloured in. If it needs a key ... add one! YES :-)
3b. How to draw a perfect scatter graph
Ok, so it takes a bit of practice but if you remember the following you will be on to a winner
Equipment needed: ruler and pencil (and an eraser if you are feeling unlucky!)
Your secret to success is to follow the rhyme 'All Four Top Drawer'
1. Title 'a scatter graph comparing .....'
2. Label the x axis - don't write 'x-axis', instead write what it is about
3. Label the y axis - don't write 'y-axis', instead write what it is about
4. Make sure the graph is accurate and neat, if it needs a key ... add one!
Tip: Adding a line of best fit gets you BONUS POINTS
Over To You: Let's check this graph out and see how well they did ......
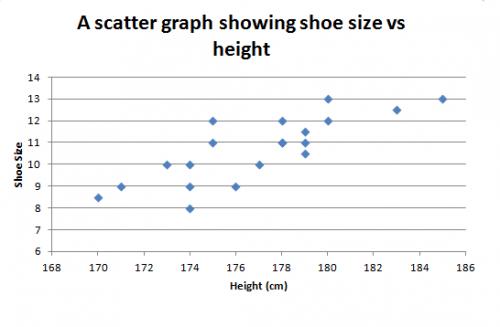
1. Title 'a scattergraph showing/comparing .....' YES :-)
2. Label the x axis - don't write 'x-axis', instead write what it is about YES :-)
3. Label the y axis - don't write 'y-axis', instead write what it is about YES :-)
4. Make sure the graph is accurate and neat. If it needs a key ... add one! YES :-)
BONUS? No :-( a Line Of Best Fit (LOBF) could have been added - see chart below
TIP: It would be good to say what sort of correlation we can see and if there are any outliers
The graph shows a positive correlation, so as height of person increases, so does shoes size.
There aren't any obvious outliers (exceptions), although you could say that 175cm tall with size 12 feet has slightly bigger feet than expected and 174cm tall with size 8 feet has slightly smaller feet than expected.
4. How to draw a perfect map
Ok, so it takes a bit of practice but if you remember the following you will be on to a winner
Equipment needed: ruler and pencil (and an eraser if you are feeling unlucky!)
Your secret to success is to follow the rhyme 'All Four Top Drawer' - only this time it is slightly different!!
1. Title 'a map to show .....'
2. Add a North arrow
3. Add a scale bar or the words 'not to scale'
4. Make sure the map is accurate and neat, if it needs a key ... add one!
Over To You: Let's check this map out and see how well they did ......
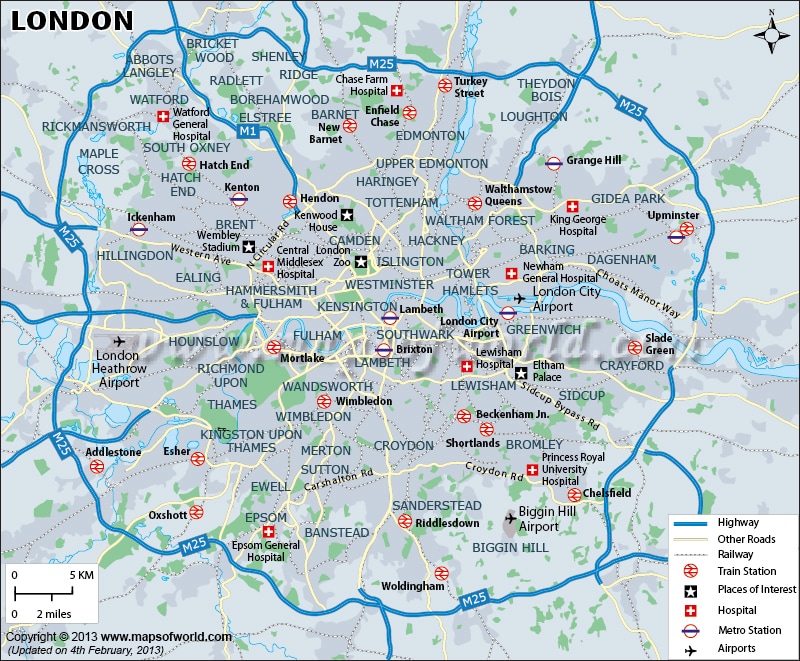
1. Title 'a map to show .....' SORT OF! :-I (top left hand corner)
2. Add a North arrow YES :-) (top right hand corner)
3. Add a scale bar or the words 'not to scale' YES :-) (bottom left hand corner)
4. Make sure the map is accurate and neat, if it needs a key ... add one! YES :-) EBI: add the word 'Key'
5. How do I know how much to write?
If you are in an exam, look at how many marks are available. Usually it is one sentence per mark, unless it is a one mark question, then the answer might be just one word or a number.
Time your answers carefully, there is usually ONE minute available per mark.
5a. How do I know what to write?
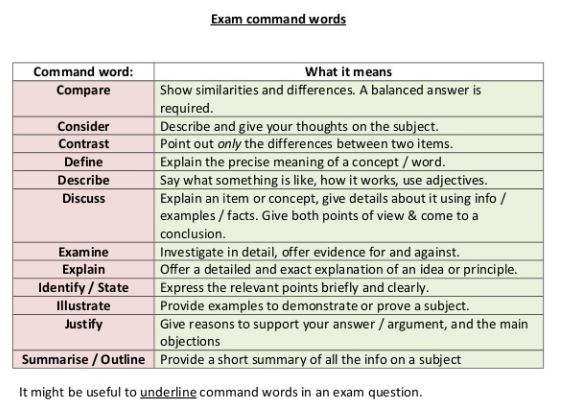
If the question asks you to 'describe' something in a photo then you might be expected to use adjectives or if it is a map to use measurements or if it is a graph, to pick out the minimum and maximum or outliers [revisit the sections above].
Try this ..... 'describe the coastal features shown in the image below'
2. Add a North arrow YES :-) (top right hand corner)
3. Add a scale bar or the words 'not to scale' YES :-) (bottom left hand corner)
4. Make sure the map is accurate and neat, if it needs a key ... add one! YES :-) EBI: add the word 'Key'
5. How do I know how much to write?
If you are in an exam, look at how many marks are available. Usually it is one sentence per mark, unless it is a one mark question, then the answer might be just one word or a number.
Time your answers carefully, there is usually ONE minute available per mark.
5a. How do I know what to write?
If the question asks you to 'describe' something in a photo then you might be expected to use adjectives or if it is a map to use measurements or if it is a graph, to pick out the minimum and maximum or outliers [revisit the sections above].
Try this ..... 'describe the coastal features shown in the image below'
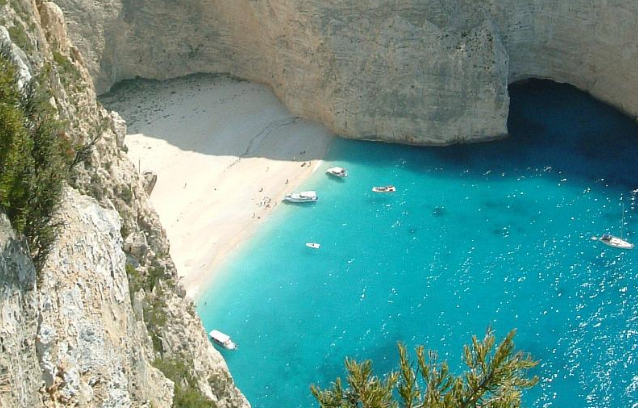
photo: Shipwreck Cove by Cebass
ANSWER: The image shows a small, narrow cove. At the back of the cove is a small, sandy beach
Try this one..... 'describe the main water feature shown in the image below'
Try this one..... 'describe the main water feature shown in the image below'
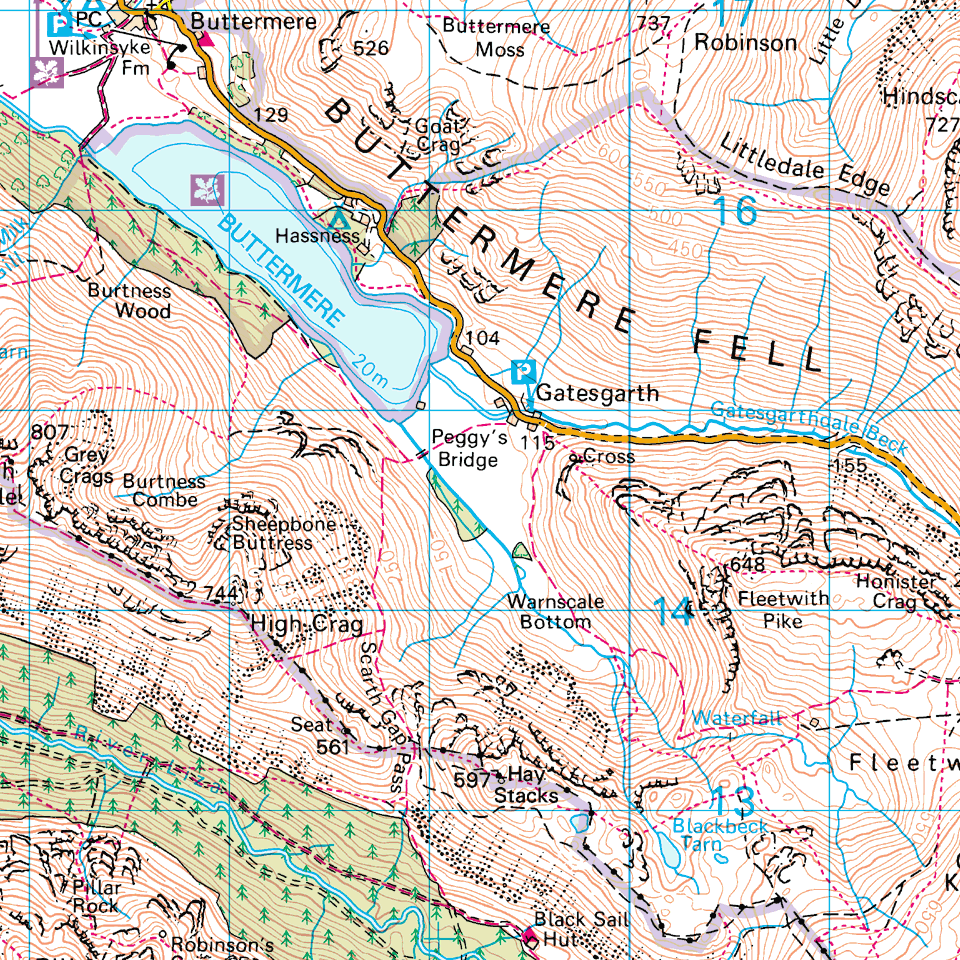
The main water feature is a lake, called Buttermere. It is almost 2km long and 0.5km wide. It is fed by a stream called Gatesgarthdale Beck.
Want more?
Check out the links pages above which will take you to external sites (OCR) about mapping and data representation skills and 'Maths for Geographers'
5b. How do I know what to write?
If the question asks you to 'explain' something then you need to be able to say why it is. If you use the TMT x 3 approach, you should be able to write enough. TMT stands for 'this means that'
Question: Explain the cause of the Los Angeles earthquake'
Model Answer
Los Angeles is located on a plate boundary where two tectonic plates meet. These plates are called the North American Plate and the Pacific Plate. This is a conservative or transform plate boundary, THIS MEANS THAT the plates are trying to slide past one another in opposite directions. The plates have jagged edges. THIS MEANS THAT they often get locked (stuck) together. THIS MEANS THAT over time friction builds up and eventually the plates are released. This is what we know on the surface to be an earthquake.
Los Angeles is located on a plate boundary where two tectonic plates meet. These plates are called the North American Plate and the Pacific Plate. This is a conservative or transform plate boundary, THIS MEANS THAT the plates are trying to slide past one another in opposite directions. The plates have jagged edges. THIS MEANS THAT they often get locked (stuck) together. THIS MEANS THAT over time friction builds up and eventually the plates are released. This is what we know on the surface to be an earthquake.
|
6a. How do I 'write impressively'?
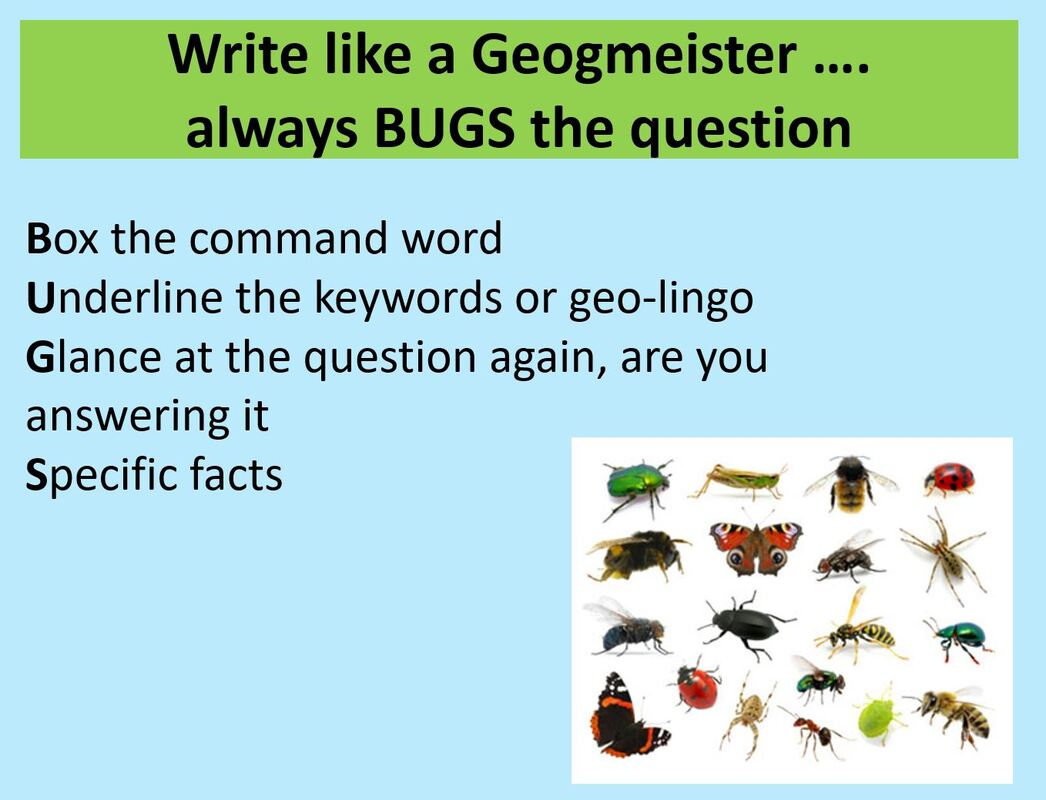
Writing like an expert Geographer is as easy as 1-2-3 .... [Don't forget to 'BUGS' the question]
|
6b. How do I 'write impressively'?
1. Know your geo-lingo - what are the important keywords that experts would use when writing about this topic? Use them in your answer.
2. Use correct spelling and punctuation. Write in full sentences. Do not use slang or abbreviate. You may abbreviate IF you already told the examiner what your abbreviations stand for. For example Longshore Drift (LSD) describes the movement of sediment along the shore. LSD involves waves swashing in on an angle and backwashing straight back out.
|
|
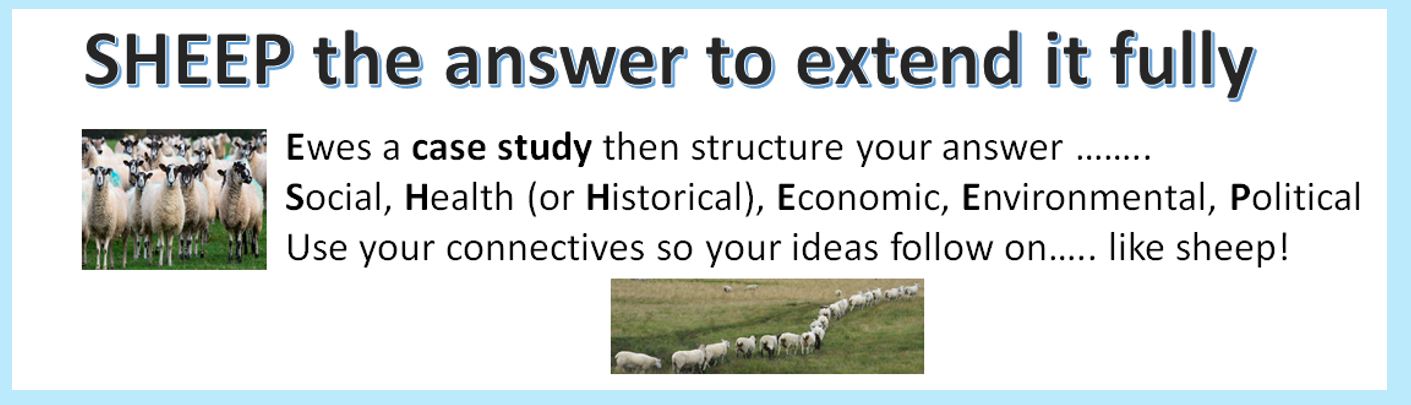
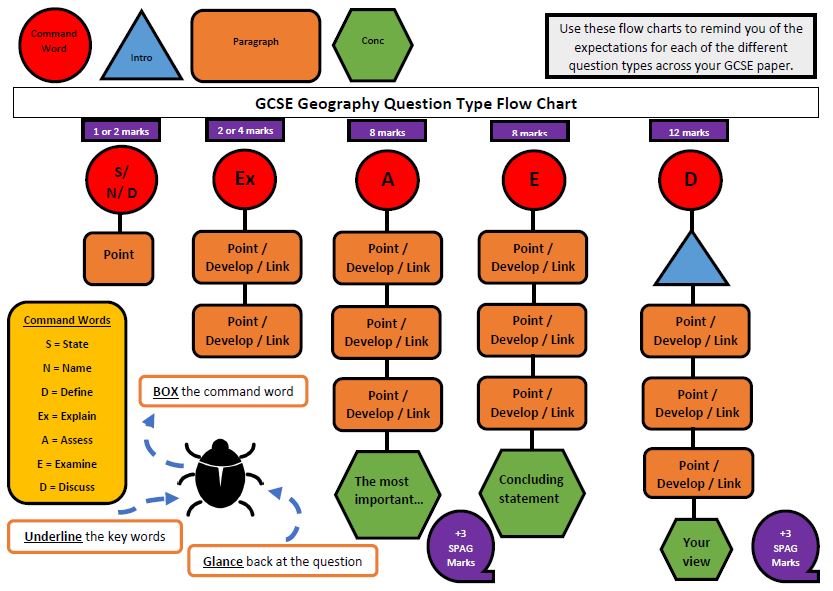
3. Answers that are worth 4 marks or more will usually require some sort of EXPLANATION. How to structure your answer will depend upon the question.Choose from ....
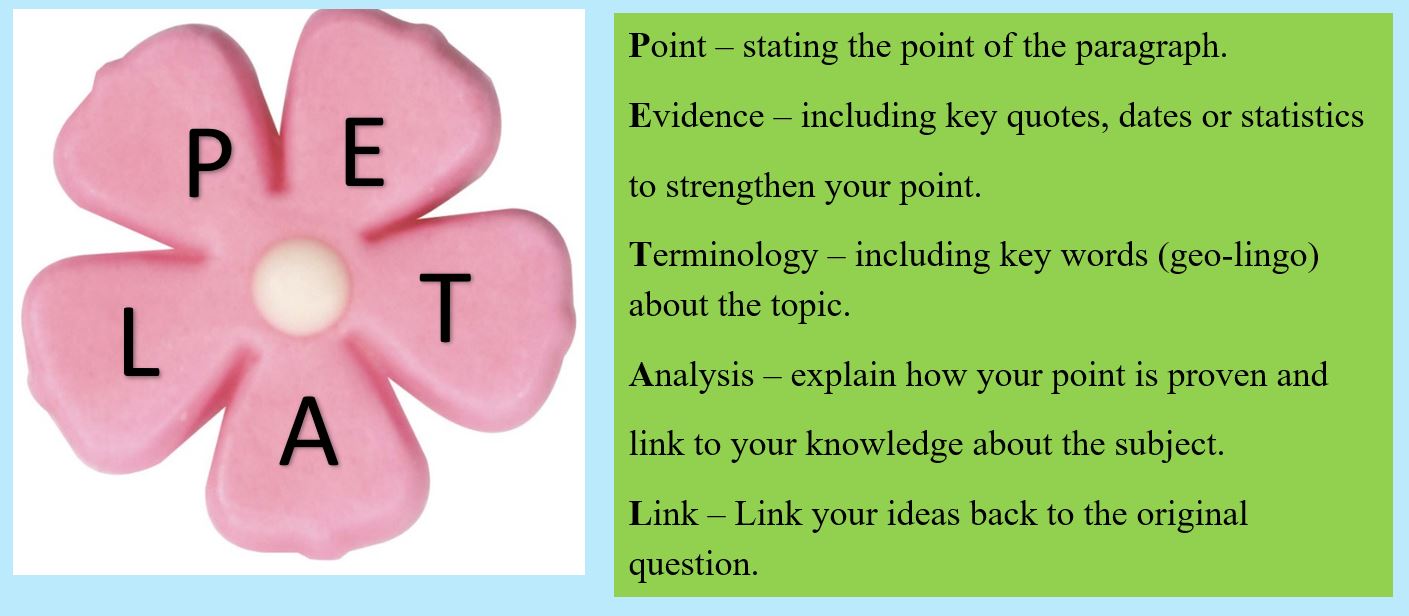
a) TMT (this means that) x 3 b) PEE - point, evidence, explanation c) PEAL - point, evidence, apply, link d) PDL - point, develop, link e) PETAL - point, evidence, terminology, analysis, link
|
7a. Using GIS in my geographical enquiry/investigation
Below is a great resource from the Field Studies Council @FSC
www.geography-fieldwork.org/gis
Below is a great resource from the Field Studies Council @FSC
www.geography-fieldwork.org/gis
| using_gis_in_geographical_enquiry_fsc.pdf |